
Rodiax Data StudioOffline Vibration Analysis for Windows
A Windows desktop application for engineers who need to analyze vibration recordings from Vibranto V-DAQ devices without relying on a cloud service or specialized software licenses. Runs entirely offline at the refinery.
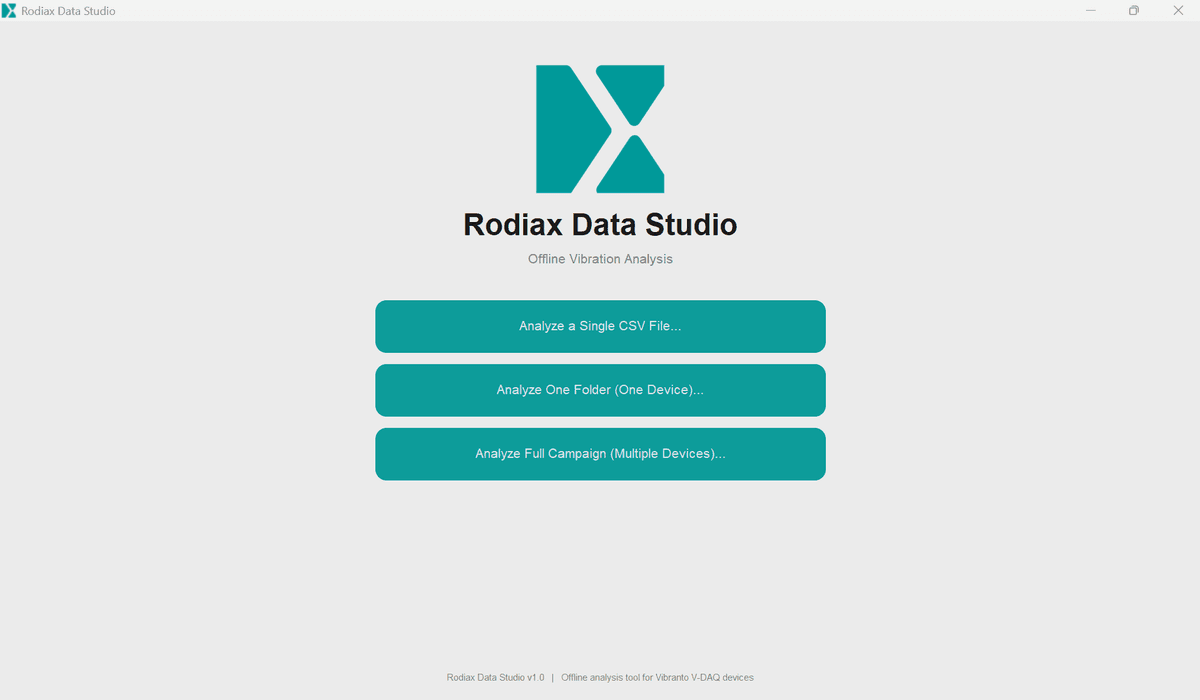
Three Analysis Modes
Single CSV File
Analyze one recording from a single V-DAQ device. Best for quick inspections and one-off diagnostics. Produces an Excel summary and an interactive comparison plot.
Single Device Folder
Process all recordings from one device across multiple days. Useful for trend analysis on a single instrumented machine. Combined Excel and a multi-day comparison chart.
Full Campaign
Analyze recordings from multiple devices placed across a facility. Cross-device comparisons make spatial vibration analysis straightforward, e.g. comparing drum A and drum B.
What You Get
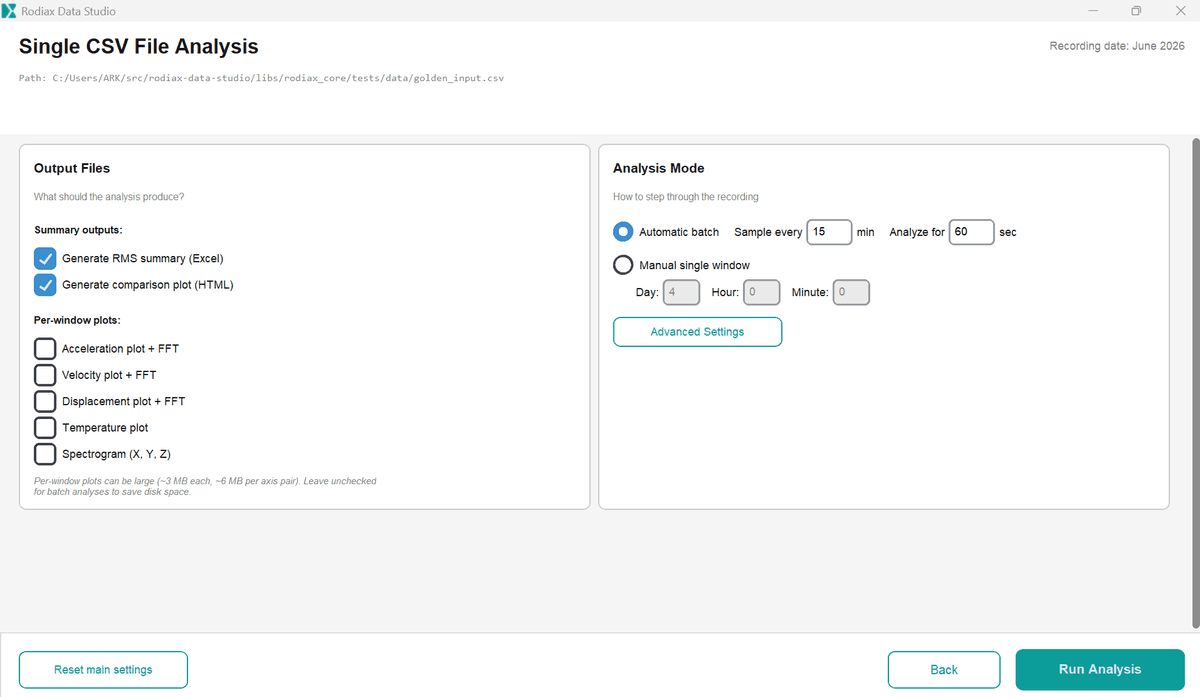
- —RMS Summary Excel — One row per 15-minute window with acceleration, velocity, displacement, and dominant frequencies per axis.
- —Interactive Comparison Plot — HTML file you can open in any browser, no internet required, with hover tooltips and zoom.
- —Per-Window Vibration Plots — Optional detailed time-series and FFT plots for each analysis window.
- —Temperature & Spectrogram Plots — Optional file-wide diagnostics for thermal effects and frequency-time visualization.
Built for Refinery Use
Offline by Design
No internet required. Process SD-card data entirely on the engineer's laptop. Critical for facilities with restricted network access.
Validated Science
Analysis algorithms validated against ground-truth data from BPCL Phase 3 vibration campaign. Reproducible results.
Engineer-Friendly
Three-click workflow from CSV to Excel. Advanced settings for engineers who need to tune parameters, sensible defaults for everyone else.